注意
最後に移動して、完全なサンプルコードをダウンロードします。または、JupyterLiteやBinderを経由してブラウザでこの例を実行します
サムネイル画像の図を提供#
この例では、サムネイルとして表示される図を提供する方法を示します。これを行うには、例ファイル内のdocstringの下のどこかでキーワード値のペアsphinx_gallery_thumbnail_path = 'fig path'をコメントとして指定します。この例では、フォルダ_static内の図demo.pngをサムネイルに使用することを指定しています。
import matplotlib.pyplot as plt
import numpy as np

# sphinx_gallery_thumbnail_path = '_static/demo.png'
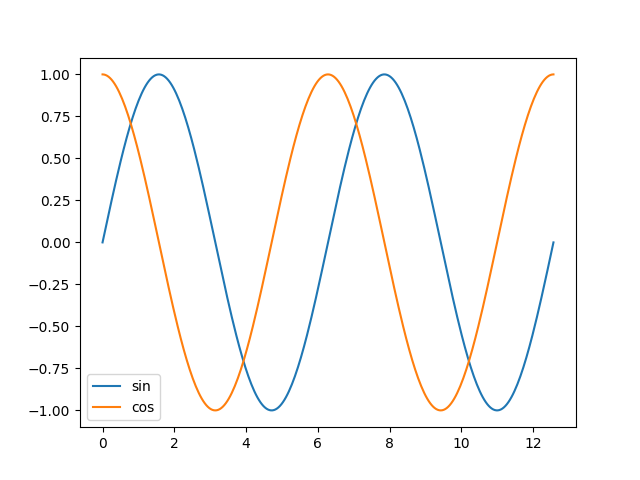
プロット1#
plt.figure()
plt.plot(x, y1, label="sin")
plt.plot(x, y2, label="cos")
plt.legend()
plt.show()
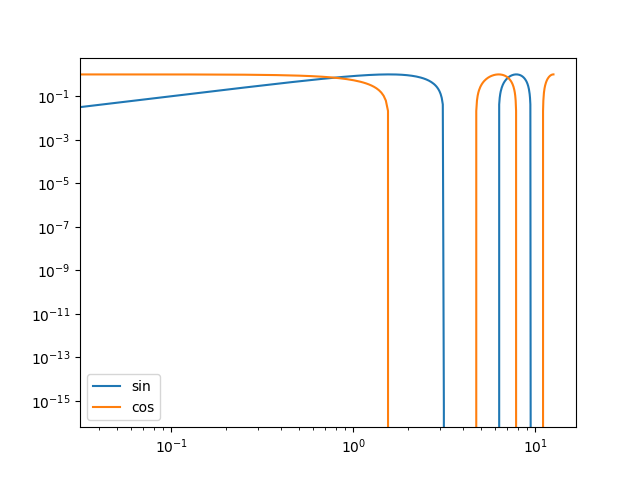
プロット2#
plt.figure()
plt.plot(x, y1, label="sin")
plt.plot(x, y2, label="cos")
plt.legend()
plt.xscale("log")
plt.yscale("log")
plt.show()
スクリプトの合計実行時間: (0分1.683秒)
推定メモリ使用量: 176 MB