注意
最後に移動して、完全なサンプルコードをダウンロードするか、JupyterLiteまたはBinderを介してブラウザでこの例を実行します
サムネイルの数字の選択#
この例は、例が複数の数字を生成する場合に、サムネイルとして表示される数字を選択する方法を示します。これは、例ファイルのドキュメント文字列のすぐ下のコメントとして、キーワードと値のペアsphinx_gallery_thumbnail_number = <fig number>を指定して行います。この例では、2番目の図をサムネイルにすることを指定します。
# Code source: Óscar Nájera
# License: BSD 3 clause
import matplotlib.pyplot as plt
import numpy as np
def main():
"""Plot expoential functions."""
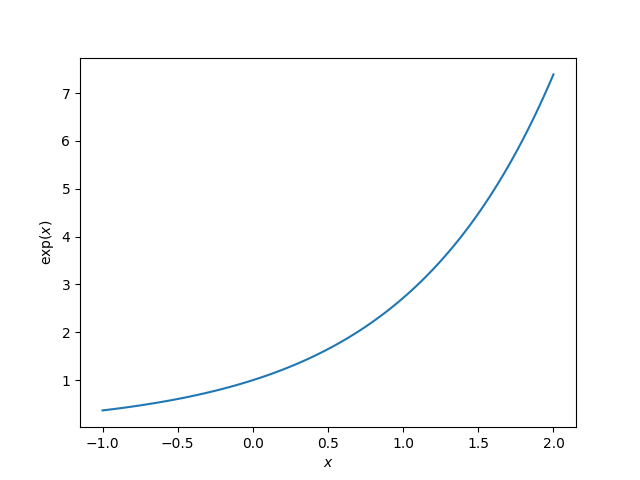
x = np.linspace(-1, 2, 100)
y = np.exp(x)
plt.figure()
plt.plot(x, y)
plt.xlabel("$x$")
plt.ylabel(r"$\exp(x)$")
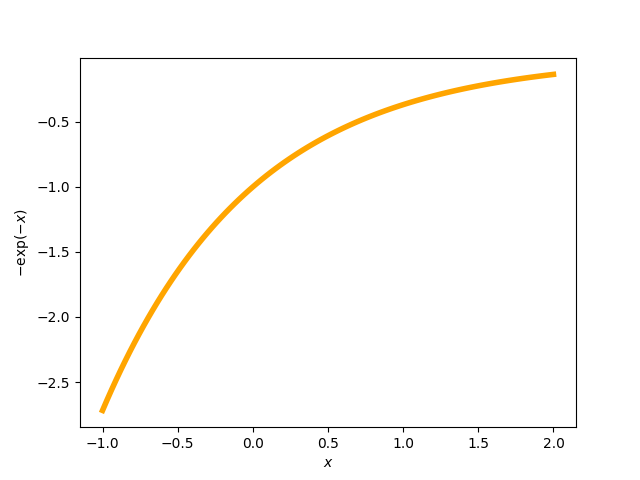
# The next line sets the thumbnail for the second figure in the gallery
# (plot with negative exponential in orange)
# sphinx_gallery_thumbnail_number = 2
plt.figure()
plt.plot(x, -np.exp(-x), color="orange", linewidth=4)
plt.xlabel("$x$")
plt.ylabel(r"$-\exp(-x)$")
# To avoid matplotlib text output
plt.show()
if __name__ == "__main__":
main()
スクリプトの合計実行時間: (0 分 0.880 秒)
推定メモリの使用量: 176 MB